
The data is already there.
Now you can see it.
Vklass analys turns the platform's everyday data into ready-made reports for the school authority, principals, student health, mentors and subject teachers. Everyone sees their part, from attendance and judgments to grades, equity and intervention tracking. The product site goes further, with the film and the reports.
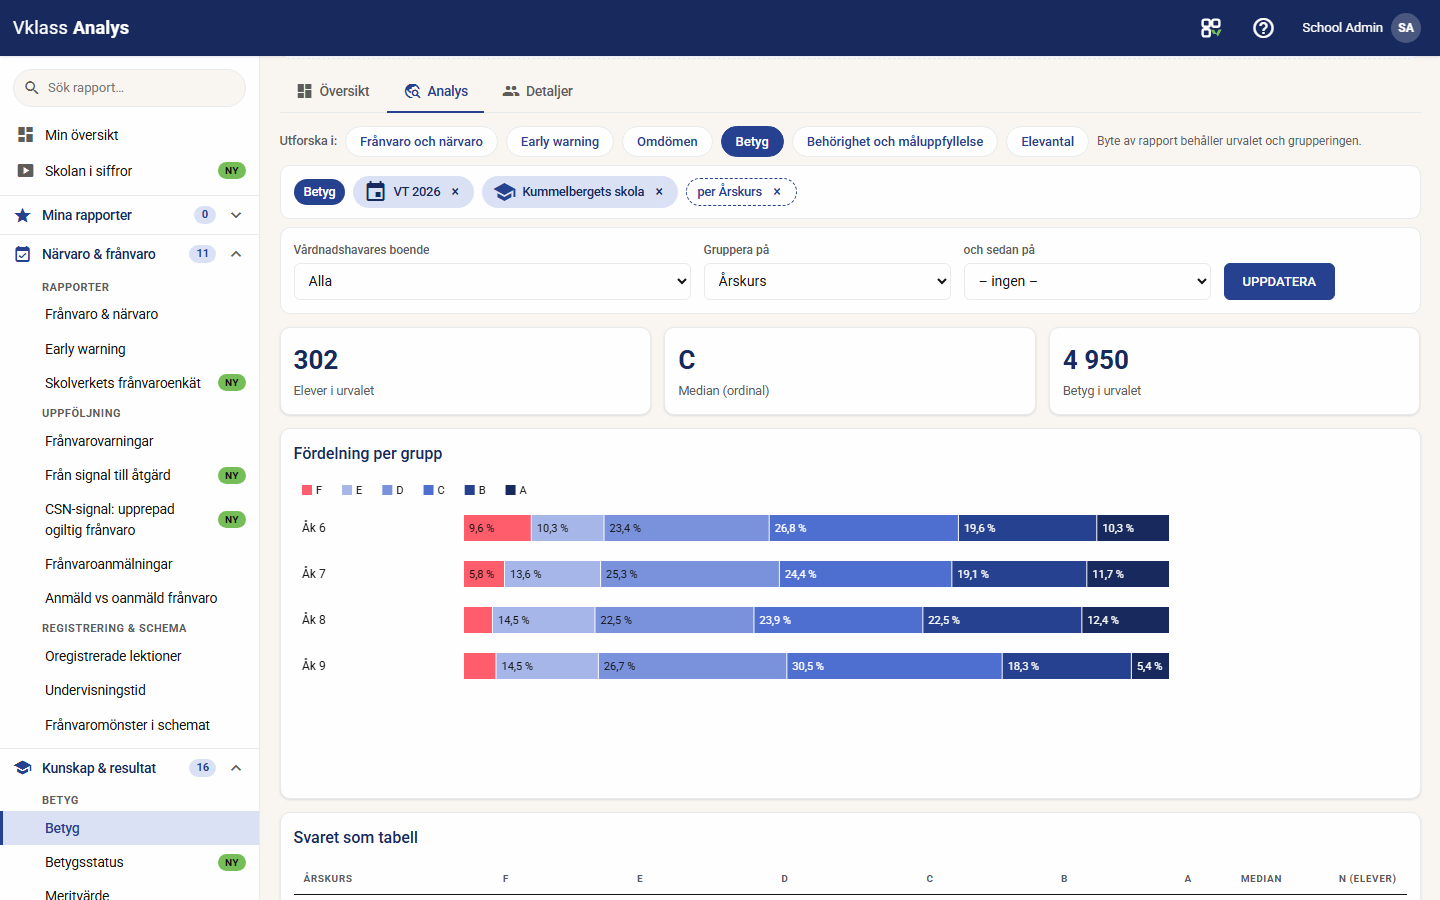
More than 40 ready-made reports and your own question
Every role gets its part of the reports, and when the ready-made reports are not enough, you ask the question yourself.
The explorer
Ask your own question in judgments, grades and attendance: filter by subject, year, gender, school form and class, group by two dimensions and switch between distribution and heatmap. The whole question lives in the link and can be shared.
Report families for the whole day
More than 40 reports cover the school's entire flow, from preschool to upper secondary. The families are attendance, early warning, the absence process, judgments, grades, national exams, eligibility, support interventions, enrollment and student flows, engagement, preschool and data quality.
National benchmarks
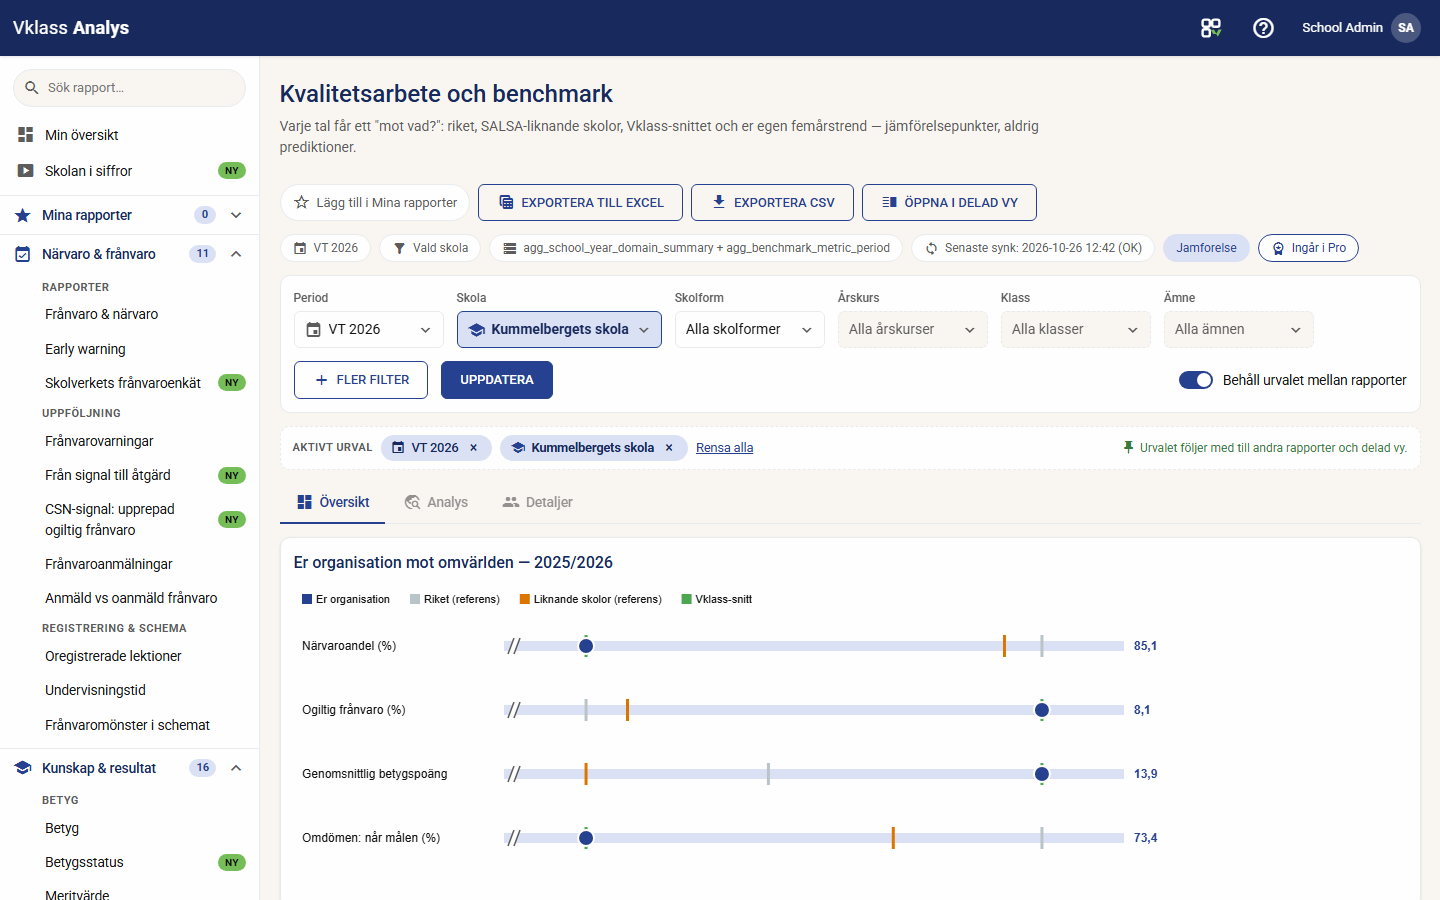
Quality & benchmark shows Skolverket's official statistics per school unit against national values, SALSA model values and Kolada municipal KPIs. Equity shows the national school survey's safety, study environment and satisfaction. All of it is open data, shown with the date it was fetched.
Statistics you can trust
Grades are shown from F to A with distribution, the share A–E and the average grade points as Skolverket counts them. Judgments are reported as distributions and never as an average of scale steps. Comparison points are references and never "expected results".
Split view
Compare up to four reports side by side in a shared workspace, on a shared scale, with saved views and synced filters. For example, compare attendance against judgments or one school against another.
From flag to intervention
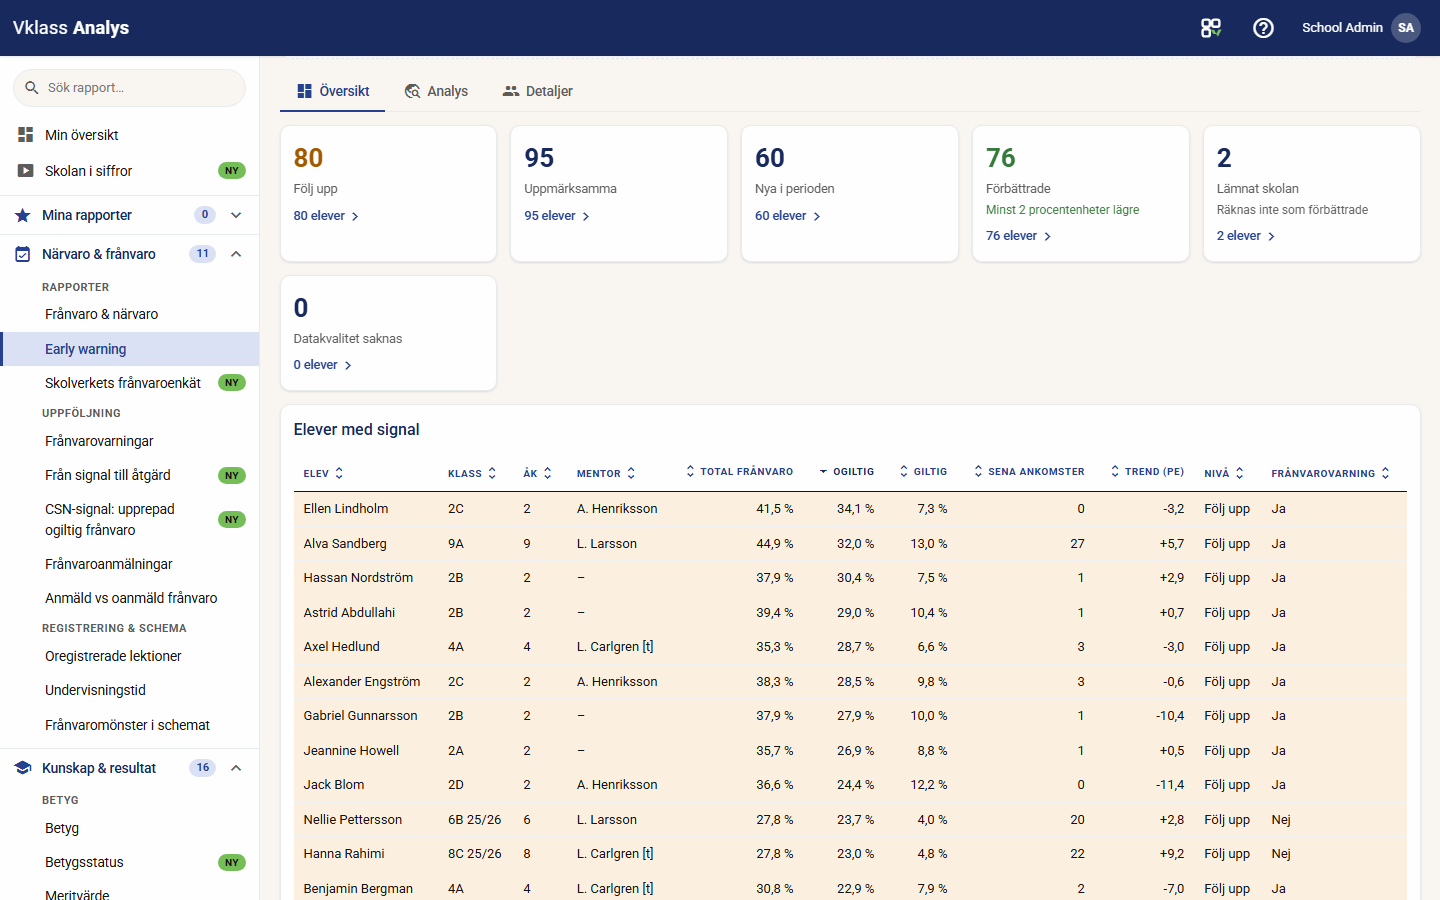
Early warning catches patterns early, and intervention tracking shows the whole pipeline from risk flag to intervention. A before/after comparison of attendance shows whether the intervention works.
The students behind the figure
Click a key figure and see which students it covers. The list has column choice, hidden names when needed and export to Excel. Permissions decide who sees student level, and every opened list and export is logged.
From signal to action
Absence is followed as the process the Education Act sets out: threshold, signal to the principal, decision, investigation, report and action. The report shows the students at each step and who is over the threshold without a decision.
The year's duties in place
The CSN signal for upper secondary, grade status before cataloging, Skolverket's absence survey and a yearly wheel that brings up what is due right now.
Ready-made reports as PDF
Six reports come with a cover, a fixed chapter order and conclusions from fixed rules, in your own graphic profile and ready to hand to the education board. The mentor gets the same reports for their class.
Shows
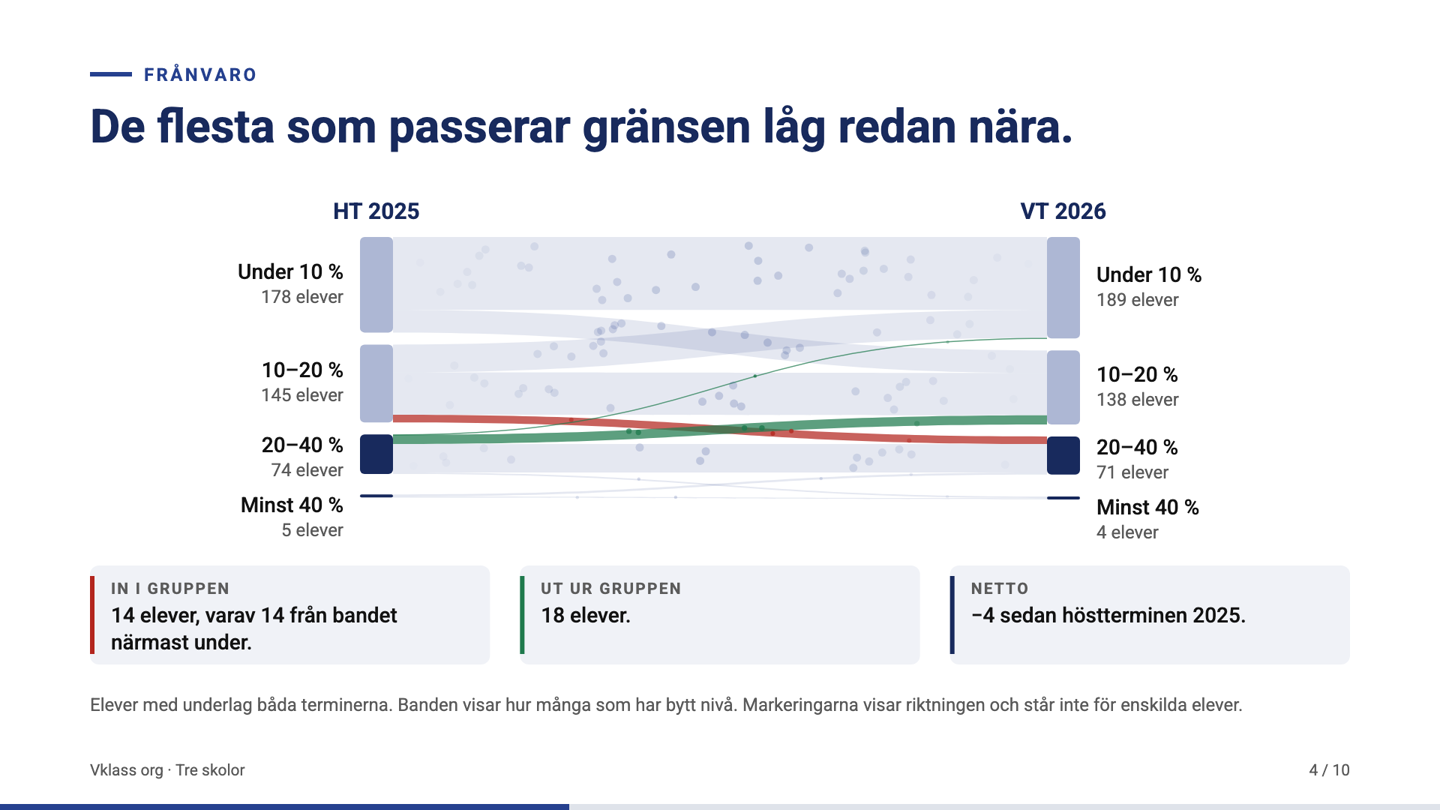
Play a report as an animated story of one to two minutes, with music and without a voice. The movement shows what a still picture cannot: the students who move between the levels from one term to the next.
School in numbers
One film for the principal and the school authority covers grades, judgments, national exams and absence. It goes school form by school form and stage by stage, split into girls and boys. Download the film as MP4 for the presentation.
The whole picture for one organization at a time
The school authority follows every school unit against the municipality average and an anonymized Vklass average. The principal and student health see their school, the mentor lands on My class and the subject teacher on My groups. Everyone works with the same data, in the right slice for their role. The municipality decides what each role sees, report by report, and the Student journey and Progression & cohorts reports follow students over time.
- Role-adapted views for the school authority, principal, student health, mentor and subject teacher
- Dedicated roles for the administration's statistics and the municipality's high-absence team
- The student list behind every key figure, with Excel export and logging
- An organization switcher for users with analytics permissions in several organizations
- Help that opens as a panel right inside the tool
- Clear empty states that distinguish permission, package, feature usage and missing sync
Take the figures further as a PDF or a film
Ready-made reports turn the tool's figures into something you can pass on. The six reports have a cover, a fixed chapter order and conclusions from fixed rules, in your own graphic profile. Every report can also be played as a show, an animated story of one to two minutes. In the show, you see the students move between the levels from one term to the next.
- Ready-made reports as PDF, with the municipality as sender
- Shows with music and without a voice, which can be downloaded as MP4 for the presentation
- School in numbers for the principal and the school authority: school form, stage and gender
- The mentor gets the reports for their own class
- The same figures and conclusions as in the tool, produced by fixed rules without a language model
Early warning that rests on research
Attendance is one of the most important success factors in school for safety, learning and equity. That is why Vklass analys is developed in a triple helix collaboration between academia, school authorities and Vklass. The Stockholm School of Economics runs a three-year research study on the link between school absence and learning outcomes. The study is funded by the Swedish Research Council and approved by the Swedish Ethical Review Authority (ref. 2025-03539-01). In a collaboration between the Stockholm School of Economics and Statistics Sweden (SCB), socioeconomic factors can also be included in the analysis. This uses a dedicated key, so that individual students cannot be identified.
- A three-year study on absence and learning outcomes, funded by the Swedish Research Council
- Anonymized data: names and personal identity numbers are removed before sharing
- Socioeconomic analysis in a collaboration between the Stockholm School of Economics and Statistics Sweden
- Participating school authorities receive reports at school authority level
Vklass analys is growing fast
Grades and judgements use valid official subjects
The area map also shows areas from five students instead of ten
The school choice flow map shows areas from five students instead of ten, since its are…
The maps place each postcode in the middle of its addresses in OpenStreetMap instead of…
School form in the filter bar
Grades, Merit value, Eligibility and Grades against national tests show the latest grad…
See your own data make sense
Book a demo and we will walk through the reports and the explorer with your school forms in focus. We will also show how the national benchmarks work.